This course is currently in draft mode
Please check back later for updates.
🔥 Trending Live Courses
Don't miss these popular upcoming sessions!

Wage and Hour Compliance in 2026: It’s More Than Just Calculating Overtime
Speaker: Vicki M. Lambert
CPE: 1.5
Date: May 14, 2026
Duration: 90 mins

1099K: What You Need to Know
Speaker: Jason Dinesen
CPE: N/A
Date: August 4, 2026
Duration: 90 mins
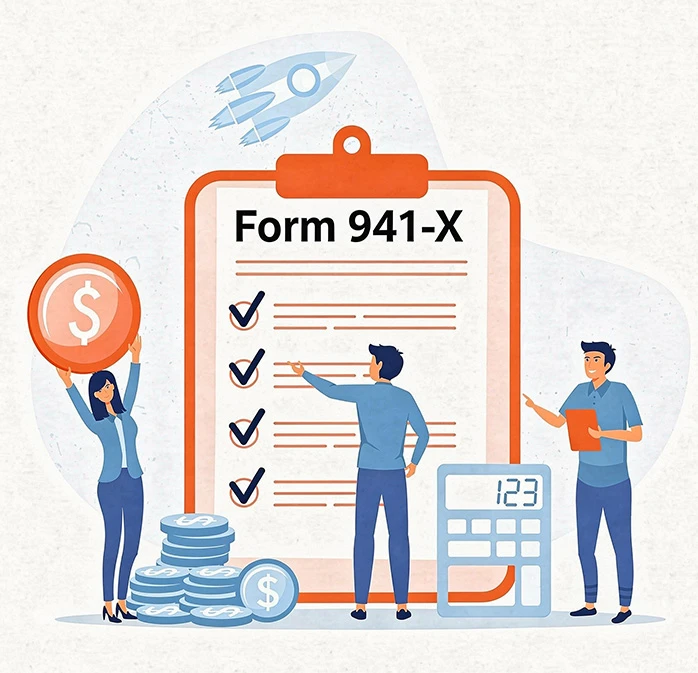
IRS Form 941-X: A Practical Guide to Payroll Tax Corrections
Speaker: Dayna J. Reum
CPE: 1.0
Date: July 28, 2026
Duration: 60 mins